We’ve all been there – you find the perfect Airbnb, only to watch the price balloon at checkout as service fees and cleaning charges pile up. That exciting $200-per-night dream rental suddenly becomes a budget-busting nightmare. But just how bad are these fees, and do they vary depending on where you’re staying? A new analysis of Airbnb listings across 84 major U.S. cities reveals some surprising answers about these controversial charges.
Key Findings:
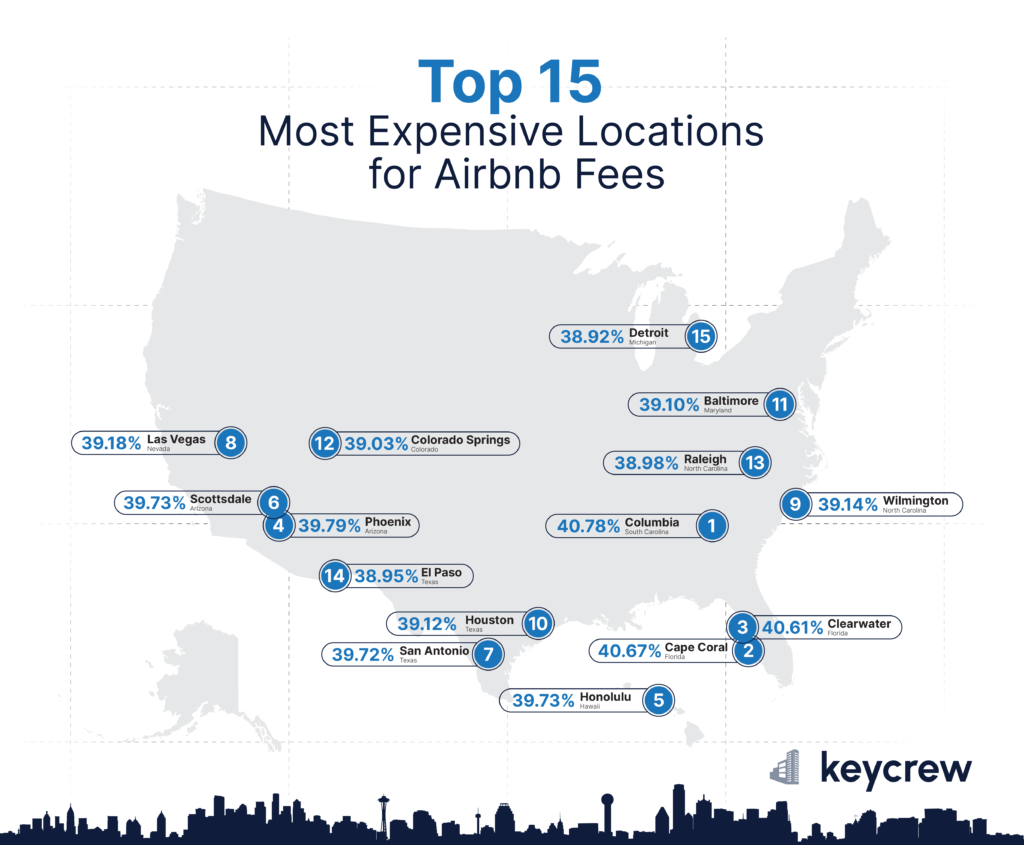
Some cities pile on average fees of up to 41% on top of the base room rate
Columbia, SC leads the nation with the highest relative fees (40.78%), adding $207 in fees to a $505 five-night stay
While California cities show the lowest fee percentages, they often have the highest dollar amounts in fees
The average combined service and cleaning fees across all cities is approximately $250 for a five-night stay
Florida dominates the high-fee percentage list with multiple cities in the top 10
The Full Results
City
State
Average Service Fee
Average Cleaning Fee
Rental Price Per Night
Rental Price 5 Nights (net of fees + taxes)
Fees as % of Rental Price For 5 Nights
Columbia
South Carolina
$114
$93
$101
$507
40.78%
Cape Coral
Florida
$266
$210
$234
$1,172
40.67%
Clearwater
Florida
$113
$87
$99
$494
40.61%
Phoenix
Arizona
$125
$93
$110
$549
39.79%
Honolulu
Hawaii
$171
$129
$151
$754
39.73%
Scottsdale
Arizona
$179
$139
$160
$798
39.73%
San Antonio
Texas
$143
$108
$126
$632
39.72%
Las Vegas
Nevada
$127
$96
$114
$569
39.18%
Wilmington
North Carolina
$142
$104
$126
$628
39.14%
Houston
Texas
$93
$70
$83
$416
39.12%
Baltimore
Maryland
$97
$67
$84
$419
39.10%
Colorado Springs
Colorado
$124
$103
$116
$581
39.03%
Raleigh
North Carolina
$127
$87
$110
$548
38.98%
El Paso
Texas
$97
$70
$86
$431
38.95%
Detroit
Michigan
$122
$84
$106
$530
38.92%
Virginia Beach
Virginia
$158
$121
$143
$717
38.91%
Cleveland
Ohio
$109
$77
$96
$479
38.79%
Jacksonville
Florida
$140
$103
$125
$627
38.75%
Atlanta
Georgia
$108
$81
$98
$490
38.61%
Vancouver
Washington
$131
$89
$114
$570
38.52%
Corpus Christi
Texas
$134
$99
$122
$608
38.26%
Omaha
Nebraska
$116
$81
$103
$515
38.20%
Tampa
Florida
$97
$68
$87
$435
38.03%
Charlotte
North Carolina
$146
$101
$130
$649
37.99%
Miami
Florida
$114
$78
$101
$507
37.97%
Tucson
Arizona
$167
$110
$146
$731
37.93%
Anchorage
Alaska
$110
$84
$103
$517
37.57%
Austin
Texas
$128
$85
$115
$574
37.06%
Kansas City
Missouri
$145
$90
$128
$642
36.61%
Flagstaff
Arizona
$200
$135
$183
$915
36.61%
Jersey City
New Jersey
$114
$72
$102
$510
36.53%
Dallas
Texas
$82
$77
$87
$434
36.53%
Indianapolis
Indiana
$114
$81
$107
$535
36.50%
Reno
Nevada
$180
$109
$158
$791
36.46%
Tulsa
Oklahoma
$151
$96
$136
$679
36.35%
Salt Lake City
Utah
$110
$69
$99
$494
36.35%
Lubbock
Texas
$135
$90
$124
$622
36.31%
Richmond
Virginia
$130
$84
$118
$590
36.26%
Columbus
Ohio
$108
$73
$100
$501
36.23%
Washington
District of Columbia
$129
$85
$118
$589
36.22%
Albuquerque
New Mexico
$114
$77
$105
$526
36.18%
Pittsburgh
Pennsylvania
$149
$93
$134
$669
36.07%
Denver
Colorado
$113
$77
$106
$528
36.05%
Memphis
Tennessee
$122
$81
$113
$566
35.92%
Seattle
Washington
$121
$83
$114
$570
35.81%
Portland
Oregon
$92
$57
$84
$420
35.55%
Chicago
Illinois
$103
$85
$106
$529
35.45%
New Orleans
Louisiana
$121
$84
$116
$578
35.45%
Chattanooga
Tennessee
$151
$89
$136
$678
35.41%
Santa Fe
New Mexico
$227
$142
$209
$1,044
35.40%
Cincinnati
Ohio
$121
$79
$114
$568
35.29%
Fort Lauderdale
Florida
$128
$89
$123
$616
35.23%
Orlando
Florida
$108
$67
$99
$497
35.22%
Carmel
Indiana
$228
$99
$186
$932
35.04%
Savannah
Georgia
$168
$98
$152
$762
34.94%
Fort Collins
Colorado
$182
$114
$170
$850
34.80%
West Palm Beach
Florida
$161
$98
$150
$748
34.68%
Milwaukee
Wisconsin
$117
$68
$107
$536
34.56%
Fort Worth
Texas
$129
$76
$119
$597
34.30%
Salem
Oregon
$92
$53
$84
$421
34.26%
Boulder
Colorado
$115
$66
$106
$531
33.90%
Knoxville
Tennessee
$139
$78
$129
$645
33.75%
Asheville
North Carolina
$143
$82
$137
$685
32.90%
New York
New York
$140
$97
$146
$728
32.54%
Boston
Massachusetts
$135
$90
$139
$695
32.40%
Philadelphia
Pennsylvania
$93
$61
$96
$478
32.27%
Waco
Texas
$172
$95
$168
$839
31.83%
Duluth
Minnesota
$213
$106
$203
$1,014
31.50%
Charleston
South Carolina
$196
$116
$200
$1,000
31.27%
San Marcos
California
$164
$105
$183
$916
29.40%
Minneapolis
Minnesota
$79
$43
$85
$424
28.86%
Sacramento
California
$130
$87
$153
$766
28.39%
Oceanside
California
$208
$146
$252
$1,261
28.06%
Newport Beach
California
$309
$206
$369
$1,844
27.95%
Anaheim
California
$163
$122
$210
$1,050
27.17%
Carlsbad
California
$226
$155
$282
$1,412
27.03%
Los Angeles
California
$123
$68
$142
$708
27.01%
San Jose
California
$88
$55
$108
$542
26.43%
Santa Barbara
California
$293
$138
$327
$1,634
26.38%
Long Beach
California
$155
$94
$189
$945
26.36%
Temecula
California
$306
$175
$370
$1,851
25.98%
San Francisco
California
$129
$77
$161
$806
25.55%
San Diego
California
$141
$90
$181
$906
25.50%
Santa Monica
California
$174
$89
$217
$1,086
24.17%
Huntington Beach
California
$194
$132
$275
$1,374
23.74%
Napa
California
$338
$135
$408
$2,040
23.19%
Santa Rosa
California
$211
$117
$296
$1,481
22.16%
Southern Cities Lead with Highest Percentage Fees Relative to Price
Columbia, South Carolina tops the list with combined service and cleaning fees reaching 40.78% of the total room price for a five-night stay. In real dollars, this means paying $207 in fees on top of a $505 base price. Florida cities feature prominently among locations with the highest fee percentages, with Cape Coral and Clearwater following closely at 40.67% and 40.61% respectively. In Cape Coral, this translates to a whopping $476 in fees on a $1,170 five-night stay.
The California Paradox: Lower Percentages, Higher Dollar Amounts
While California cities consistently show the lowest fee percentages, the actual dollar amounts tell a different story. Take Napa, for example: while its 23.19% fee rate seems modest, guests actually pay $473 in fees ($338 service fee + $135 cleaning fee) on a five-night stay. Santa Barbara charges $431 in total fees, and Newport Beach adds $515 in fees, despite their lower percentage ratings. This apparent paradox is explained by California’s significantly higher base room rates – Napa averages $408 per night compared to Columbia’s $101.
Major Metropolitan Areas: Middle Ground in Both Percentages and Dollars
Major metropolitan areas maintain moderate fee structures in both percentage and dollar terms. New York City charges about $237 in total fees on a $728 five-night stay (32.54%), Boston adds $225 in fees to a $695 stay (32.40%), and Philadelphia keeps fees to $154 on a $478 stay (32.27%). These figures suggest bigger cities have found a middle ground in their fee structures.
Airbnb Fee Examples
Let’s look at some concrete examples for a five-night stay:
Columbia, SC: $101/night → $505 base + $207 fees = $712 total
Cape Coral, FL: $234/night → $1,170 base + $476 fees = $1,646 total
Napa, CA: $408/night → $2,040 base + $473 fees = $2,513 total
New York City: $146/night → $728 base + $237 fees = $965 total
Consumer Implications
These findings highlight why it’s crucial to look beyond both percentage rates and base prices. While California’s fee percentages might look attractive at first glance, the actual dollar amounts can be significantly higher than in other regions. Conversely, while Columbia, SC’s 40.78% fee rate sounds steep, the actual fee amount ($207) is lower than many California cities charging half that percentage rate.
The data suggests that savvy travelers should consider both the percentage and dollar amount of fees when comparing locations. A high fee percentage in a budget-friendly city might actually cost less than a low fee percentage in an expensive destination. This nuanced approach to evaluating costs could lead to significant savings when planning your next Airbnb stay.
Methodology
In October 2024, we analyzed the 150 most searched for cities for Airbnbs according to Google search data, by searching for a five-night stay for 1 person for an entire home from December 16 to 21, 2024 in each of these locations on Airbnb. We then removed any city from our list with an insufficient amount of available rentals, to leave only the cities with a sufficient quantity of rentals to provide a fair average for each location. We collected the room price, cleaning fee and service fee for each rental, then calculated the average for each city.
Similar Articles
Explore similar articles from Our Team of Experts.
When Luis Aurelio Diaz returned to Colombia in 2003 to take the helm of his father’s real estate development company, he faced a stark reality. The Colombian economy was recovering fro...
In the fast-paced world of South Florida real estate, William (Billy) Cunningham III stands out as a dealmaker who turned his extensive network and entrepreneurial drive into a thriving real...
In the picturesque Adirondacks of New York, a former executive from Google is applying big data principles to transform historic properties into thriving hospitality ventures. Rick Vidal, ow...
“We don’t sell houses—we sell community,” says Nick Schlekeway, Founder and Designated Broker of Amherst Madison, a brokerage that has grown from $14 million in sales its...
From his vantage point in Boston’s commercial real estate market, Casey Valente is witnessing a remarkable transformation. As foreign capital flows in and creative deal structures emer...
Looking for a real estate investment opportunity with a potential return on investment as big as the Lone Star State? Dallas, Texas is the place to be. Getting started with real estate...